Our Experience
When I first calculated my personal greenhouse gases, I found out my vacation travel was a huge problem in what otherwise was a reasonably green lifestyle. So, I tried Amtrak (when Amtrak went where I was going) and thanks to Covid, I now schedule Zoom weekly to keep up with my remote family. I am not perfect – I still struggle with Transportation as the area I have the most problems with.
Your Choices
| Action Choices and Links | Cost | Notes |
| Take Fewer Long Distance Trips | Save $$ to $$$ | Zoom or other video tool can save time and expenses. |
| Use Efficient Public Transportation: Rail or Bus … or Fill Your Car | $ to $$$ | Gone: Expensive parking fees, rush hour traffic, do other things while traveling |
| Ride a Public Bike or E-Bike or Scooter | $ | Good mobility eliminates parking fees. |
| For Purchases: Avoid Items Flown In or Trucked Long Distances | Save $ |
Take Fewer Long Distance Trips
Public transportation can reduce or eliminate costly car purchases, parking fees and auto insurance, and can get you there faster during rush hour (particularly with trains and subways). Also, public transportation often reduces greenhouse gases. Although the per mile greenhouse gas numbers are small, when traveling long distance the miles or kilometers and greenhouse gases quickly add up. For example, the table below lists 4 hypothetical trips within the U.S., Europe, and between U.S. and Europe, and shows the 1-way and round-trip greenhouse gas emissions (GHG) in Kg. One round-trip New York to Paris is over 1 metric ton (1000 Kg) and NY to Los Angeles is 80% of one ton (round-trip). In contrast, an Amtrak train ride between Boston and Washington DC would be 51 Kg; half the greenhouse gases of air transport.
Greenhouse Gas for Airline Trips – Examples
| Example air travel | Flight Distance (flight miles) | GHG (in Kg/mile) | 1-way (Kg GHG) | Round trip (Kg GHG) |
| New York to Los Angeles | 2445.55 | 0.164395 | 402.0 | 804.1 |
| New York to Paris | 3627.01 | 0.164395 | 596.3 | 1192.5 |
| Stockholm to Rome | 1228.35 | 0.130103 | 159.8 | 319.6 |
| Boston to Washington DC | 391.69 | 0.130103 | 51.0 | 101.9 |
Use Efficient Public Transportation: Rail or Bus … or Fill Your Car
The next table contrasts the efficiency of different modes of travel. Personal transportation (car, truck, motorcycle) assumes greenhouse gas per vehicle mile, whereas other transportation assumes passenger-miles. Therefore, if you load a car up with 4 family members, your passenger car GHG/mile will be ¼ of the listed rate. Also, your miles per gallon may vary from what is shown here depending on vehicle.
| Vehicle Type | Kg GHG/Mile | Assumptions (per passenger-mile, unless stated otherwise) |
| Passenger Car | 0.307842 | Per vehicle mile: Assumes 28.9 miles per gallon |
| Light-Duty Truck | 0.407958 | Per vehicle mile |
| Motorcycle | 0.383583 | Per vehicle mile |
| Intercity Rail – NE Corridor | 0.0583395 | U.S.: Amtrak Between Boston and Washington DC. |
| Intercity Rail – Other Routes | 0.1513346 | U.S.: Amtrak |
| Intercity Rail – Nat. Avg | 0.1139466 | U.S.: Amtrak |
| Commuter Rail | 0.133983 | Between City – Suburb |
| Transit Rail | 0.093475 | Within City: Subway or Tram |
| Bus | 0.0716965 | |
| Air Travel – Short Haul (< 300 miles) | 0.2089282 | Take-off and landing require more fuel than cruising. (Bellaigue, 2023) |
| Air Travel – Medium Haul (Between 300 – 2300 miles) | 0.1301033 | To estimate distance: commercial airlines cruise at 500 – 600 miles per hour or 800-970 km/h. |
| Air Travel – Long Haul (>= 2300 miles) | 0.1643948 | Long haul rate goes up because additional fuel must be carried (Bellaigue, 2023) |
From: https://www.epa.gov/system/files/documents/2024-02/ghg-emission-factors-hub-2024.pdf
Cruises (for people) rate below airlines in sustainability. Newer cruise ships may perform better than older ones, and Friends of the Earth does try to track the performance of cruise lines and individual ships.
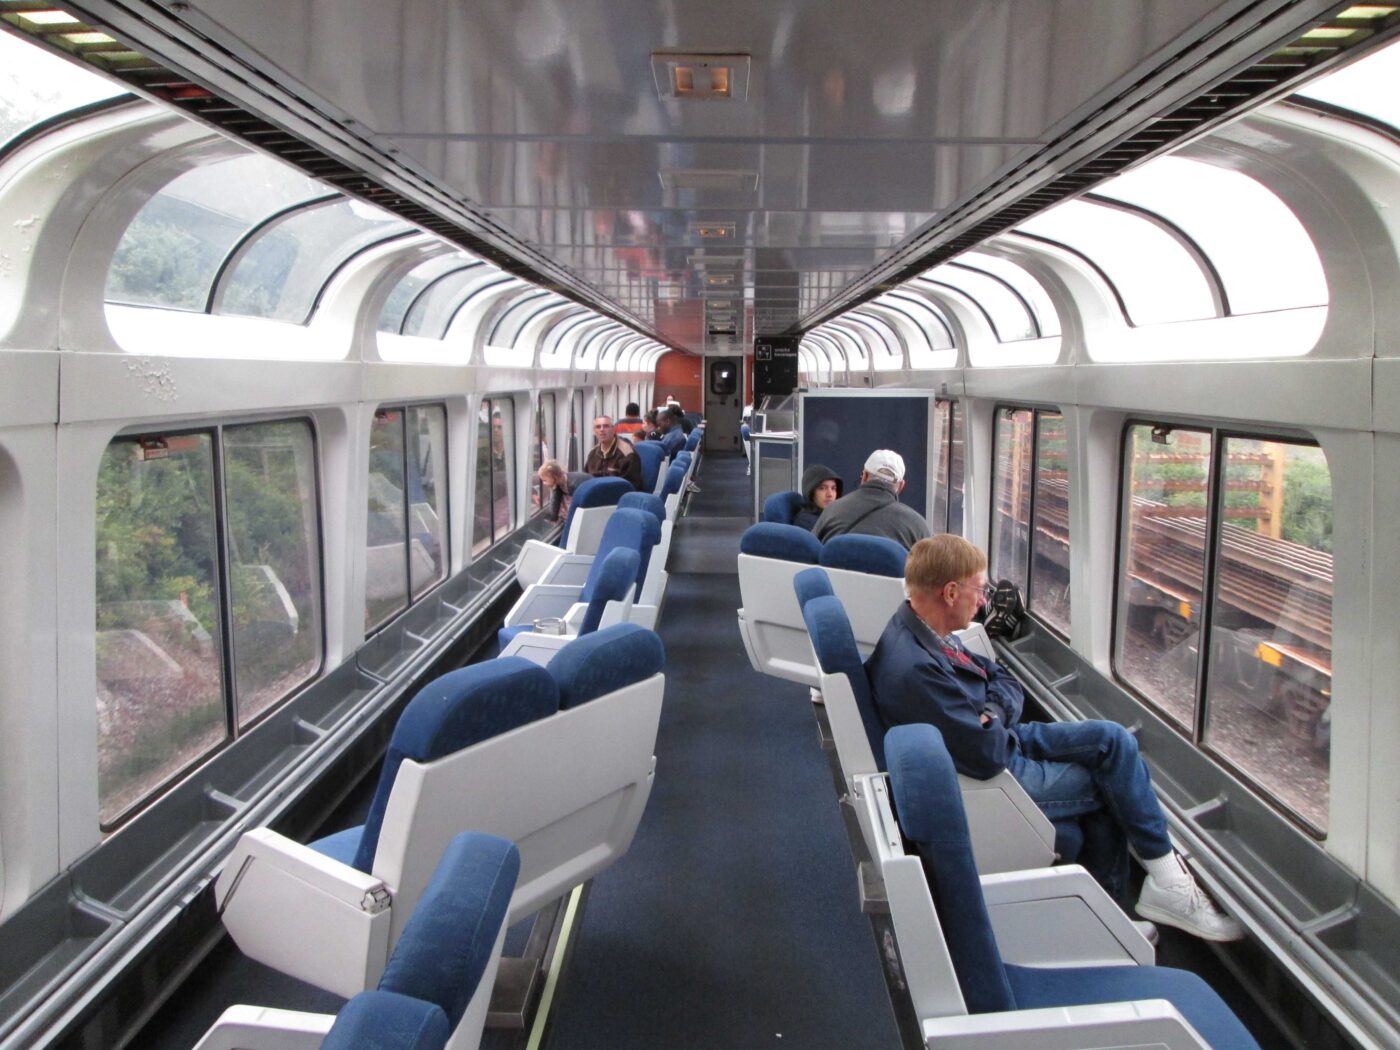
Amtrak provides a food stand, a dining car, sleeper cars, and a recreation car, such as this full-window car with seats facing out and tables.
Ride a Public Bike or E-Bike or Scooter
Cities and universities often provide a public bike, e-bike and/or scooter rental service, often hosted by companies like Lime or Pogoh. Basically, you rent the vehicle from one station and return it to another official station close to your destination. By downloading the app on your cell phone, you may rent personal transportation for 1/2 hour, or by the month or annually for 30 or 60 minutes/day. As an example, Pittsburgh offers a service where a pedal bike (non-motorized) or e-bike costs $4.50 or $6, respectively, for 30 minutes use. Monthly or annual subscriptions offer lower 30-minute fees, if you exceed your subscribed time (https://pogoh.com/)
For Purchases: Avoid Items Flown In or Trucked Long Distances
Transporting of goods rates differently from transporting of people, since transportation of goods is measured in greenhouse gas emissions per ton per mile. Short-ton is a U.S.-only measure, whereas one metric ton = 1000 kg (commonly used on this website). The transport order is shown in order of efficiency: rail, water, truck, air transport.
| Vehicle Type | GHG per Short-ton (U.S.) mile | GHG per Metric ton/mile |
| Rail | 0.0221801 | 0.02012 |
| Waterborne Craft | 0.0834693 | 0.07572 |
| Medium- and Heavy-Duty Truck | 0.1692875 | 0.15358 |
| Aircraft | 0.9123935 | 0.82771 |
From: https://www.epa.gov/system/files/documents/2024-02/ghg-emission-factors-hub-2024.pdf
References
EPA (2024) Emission Factors for Greenhouse Gas Inventories. Center for Corporate Climate Leadership, U.S. Environmental Protection Agency. June 5, 2024. From: https://www.epa.gov/system/files/documents/2024-02/ghg-emission-factors-hub-2024.pdf.
Christopher de Bellaigue (2023) Flying Green: On the Frontiers of Aviation. Columbia Global Reports, New York NY USA.