
Decreasing energy use reduces a major home cost and makes your home more comfortable. Compare your energy use against others in your state, knowing that most homes are pretty inefficient and can be improved.
Your Choices
| Action Choices and Links: Compare Energy Use |
| Compare Your Energy Use Contrasting By State Averages |
| Calculate How Your Home Compares |
| Reduce Your Energy Usage |
Compare Your Energy Use Contrasting By State Averages
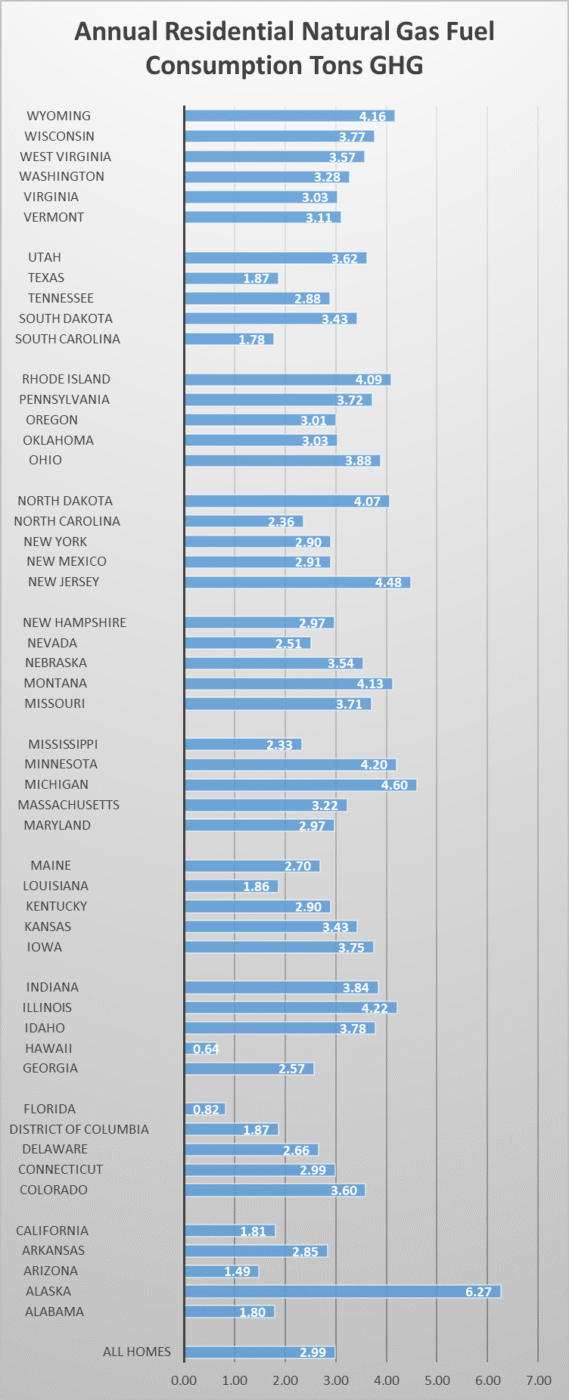
Compare your energy use in the graph and table below. The graph shows natural gas use, when used, in residential homes. Results are shown in annual metric tons of greenhouse gases per average household. Actual natural gas use data in million BTU (one measurement of natural gas use) is provided in the table below.
Notice that the U.S. residential average is 2.99 metric tons of greenhouse gases for a home of 1,818 square feet.
Source of MMBtu/home: EIA (2023)
The following table provides results for the ten most populous states (and a couple additional western states to fill in map holes). Data provided is the average home size in square feet and the direct natural gas usage for home use, not including electricity generation.
| State | Space in square feet | Million Btu (MMBtu) |
| South Dakota | 2056 | 64.5 |
| Michigan | 2030 | 86.6 |
| Ohio | 2013 | 73.1 |
| Colorado | 1999 | 67.7 |
| Pennsylvania | 1991 | 70 |
| Georgia | 1974 | 48.3 |
| Illinois | 1924 | 79.5 |
| North Carolina | 1901 | 44.4 |
| US Average | 1818 | 56.3 |
| Texas | 1734 | 35.3 |
| Florida | 1623 | 15.5 |
| New York | 1614 | 54.6 |
| California | 1504 | 34.1 |
Source: MMBtu: EIA 2023; home size: EIA 2023b
Calculate How Your Home Compares
To calculate how you compare, see webpage Calculate Your Footprint. The provided spreadsheet enables you to enter your heating oil, propane or natural gas usage in a number of measurement units. For average home electricity usage and their greenhouse gas effects, see Compare your electrical usage.
Reduce Your Energy Usage
To reduce your energy usage, see Ways to Save Energy and Ways to Save Electricity.
References
Energy Information Administration (EIA) (2023) Annual household site fuel consumption in U.S. homes by state—totals and averages, 2020 Data release date: March 2023. U.S. Energy Information Administration, Office of Energy Demand and Integrated Statistics, Accumulated from Forms EIA-457A, D, E, F, & G of the 2020 Residential Energy Consumption Survey.
Energy Information Administration (EIA) (2023b) Residential Energy Consumption Survey (RECS) Dashboard. From: Source: https://experience.arcgis.com/experience, taken November 20, 2025.