
Don’t we all want to spend less money on utilities? For the most accurate and convenient way to compare your electricity use with similar homes, log in to your electric provider’s website. They typically offer detailed records of your electric consumption in kilowatt-hours, along with your costs, for the past year. Some providers also offer comparisons showing how your home’s usage stacks up against others in your neighborhood. Then, enter your monthly kilowatt-hours into the Calculate Your Footprint spreadsheet.
Alternatively, if you already have a good feel for your average bill, contrast your electrical use against other U.S. homes, below.
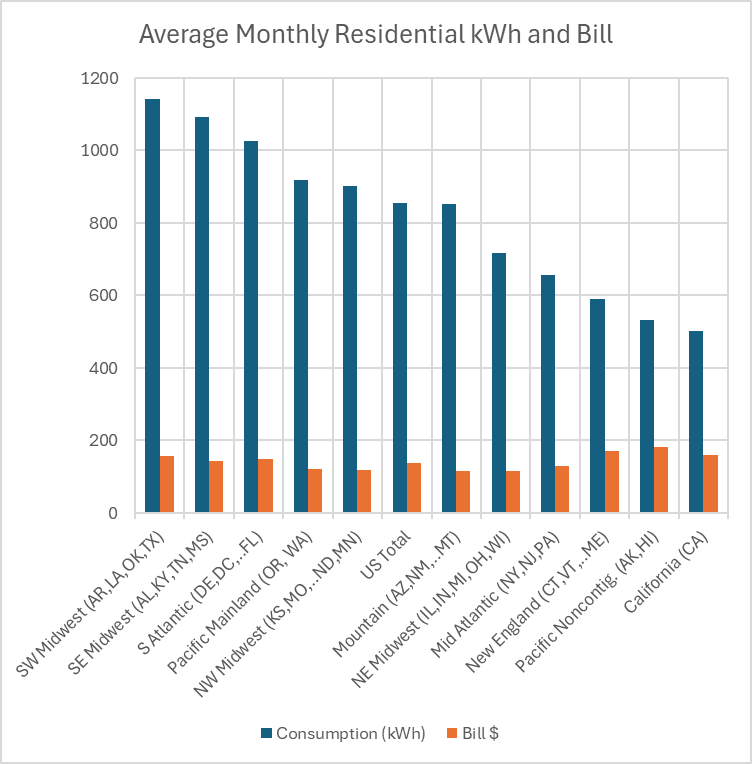
Compare your Electricity Use and Cost against Average U.S. Homes
This figure and table below compares U.S. residential electrical usage (EIA, 2024):
- International greenhouse gas emissions per Kilowatt Hour, shown locally: https://app.electricitymaps.com/map/live/fifteen_minutes.
- Average U.S. homes pay $161 monthly, ranging between $94 in New Mexico to $212 in Hawaii.
- Average U.S. electricity consumption is 855 kilowatt-hours (kWh) per month, varying from 495 kWh in Hawaii to 1,202 kWh in Louisiana.
- Annual U.S. greenhouse gases per household average 3,841 kilograms (nearly 4 metric tons), ranging from 133 kilograms in Vermont to over 11 tons in West Virginia.
Factors Affecting Greenhouse Gases: Usage and Energy Source
Your electrical usage affects your costs and greenhouse gases. The graph indicates that southern states consume the most electricity, likely driven by air conditioning needs. In contrast, northern states primarily use natural gas and oil for heating during winter, which is not reflected in this data.
The energy sources powering each state also highly affect your greenhouse gas impact. Vermont, for example, has very low emissions due to its heavy reliance on renewable energy, with 52% hydroelectric power supplemented by biomass and wind. In contrast, West Virginia relies nearly exclusively (90%) on coal for power generation (EPA, 2022). If greenhouse gases are extremely high in your state it may preferable to prioritize energy efficiency or reducing electricity.
Compare Your Electricity Use with the Average Home in Your State
If your average monthly kilowatt-hours are at or above average, know that you likely can reduce consumption with a little effort in the electricity and energy efficiency areas. Improvements will result in increased comfort and reduced energy costs. This table also provides average monthly annual greenhouse gases, which factors in each state’s energy sources (EPA, 2022).
| State | Average Monthly kWh | Average Monthly Bill ($) | Annual Greenhouse Gases |
| Alabama | 1,143 | 173.5 | 4923.5 |
| Alaska | 578 | 143.54 | 2886.4 |
| Arizona | 1,075 | 160.24 | 4165.7 |
| Arkansas | 1,048 | 129.13 | 6055.4 |
| California | 503 | 160.86 | 1252.5 |
| Colorado | 674 | 100.57 | 4303.9 |
| Connecticut | 695 | 199.66 | 1979.6 |
| Delaware | 911 | 150.87 | 4466.7 |
| District of Columbia | 639 | 113.23 | 1930.0 |
| Florida | 1,104 | 156.09 | 4918.9 |
| Georgia | 1,074 | 151.25 | 4332.9 |
| Hawaii | 495 | 212.12 | 3943.3 |
| Idaho | 944 | 108.73 | 1276.5 |
| Illinois | 693 | 109.99 | 2234.6 |
| Indiana | 901 | 133.06 | 7732.0 |
| Iowa | 832 | 111.54 | 2814.9 |
| Kansas | 876 | 123.9 | 3939.7 |
| Kentucky | 1,047 | 133.81 | 9872 |
| Louisiana | 1,202 | 140.96 | 5369.2 |
| Maine | 550 | 133.6 | 1026.0 |
| Maryland | 929 | 165.87 | 3238.8 |
| Massachusetts | 570 | 167.2 | 2665.8 |
| Michigan | 618 | 119.31 | 3416.7 |
| Minnesota | 712 | 110.06 | 2998.9 |
| Mississippi | 1,156 | 154.83 | 5591.9 |
| Missouri | 1,001 | 129.18 | 8269.6 |
| Montana | 852 | 107.91 | 4782.9 |
| Nebraska | 956 | 110.28 | 5753.4 |
| Nevada | 930 | 139.39 | 3435.9 |
| New Hampshire | 619 | 144.87 | 1032.5 |
| New Jersey | 662 | 128.13 | 1760.5 |
| New Mexico | 654 | 92.88 | 3530.0 |
| New York | 571 | 139.53 | 1527.1 |
| North Carolina | 1,015 | 143.5 | 3630.4 |
| North Dakota | 1,029 | 118.38 | 7401.3 |
| Ohio | 846 | 135.16 | 5351.4 |
| Oklahoma | 1,079 | 132.05 | 4047.3 |
| Oregon | 882 | 129.62 | 1435.8 |
| Pennsylvania | 817 | 145.17 | 3176.2 |
| Rhode Island | 567 | 162.4 | 2506.6 |
| South Carolina | 1,050 | 149.51 | 3200.2 |
| South Dakota | 994 | 127.81 | 1768.9 |
| Tennessee | 1,154 | 143.32 | 4382.6 |
| Texas | 1,096 | 163.72 | 4903.4 |
| Utah | 774 | 94.57 | 6421.6 |
| Vermont | 574 | 125.66 | 133.1 |
| Virginia | 1,032 | 148.77 | 3314.0 |
| Washington | 955 | 113.68 | 966.7 |
| West Virginia | 1,027 | 154.76 | 11,036.6 |
| Wisconsin | 645 | 110.87 | 4137.2 |
| Wyoming | 863 | 107.65 | 8537.9 |
| US Average | 855 | 160.86 | 3851.2 |
Sources: EIA (2024) for electric use and costs; EPA (2022) for state emissions and greenhouse gases.
Return to Save Electricity to learn how to reduce electrical use and impact.
References
EIA (2024) Average Monthly Bill-Residential. U.S. Energy Information Administration. From: https://www.eia.gov/electricity/sales_revenue_price/pdf/table_5A.pdf. Taken 21 October 2025.
EPA (2022) eGRID Summary Tables 2022. From: https://www.epa.gov/system/files/documents/2024-01/egrid2022_summary_tables.xlsx. Taken 21 October 2025.
EPA (2024) Emission Factors for Greenhouse Gas Inventories. Last Modified: June 5, 2024. From: https://www.epa.gov/system/files/documents/2024-02/ghg-emission-factors-hub-2024.pdf. Taken 21 October 2025